
While the top of the T10 bowling charts features efficient giants, the bottom reveals the struggles faced by the least effective teams.
🌟 The Top Tier: Efficiency and Volume
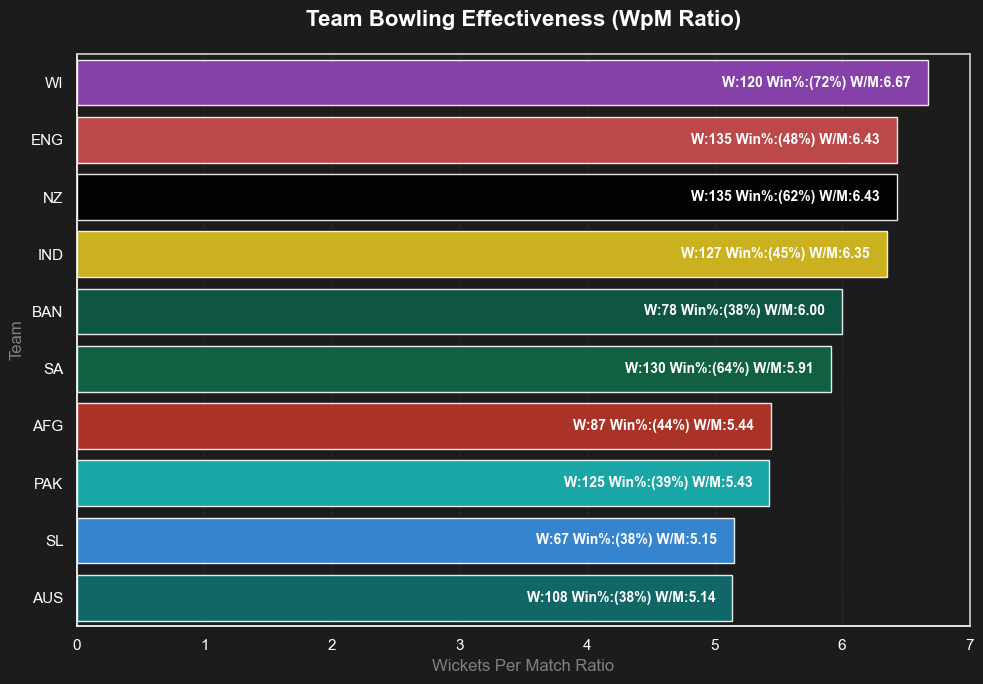
The West Indies (WI) stand out for their superior efficiency, boasting the highest Wickets per Match (WpM) ratio at 6.67, which directly correlates with an exceptional 72% win rate. England (ENG) and New Zealand (NZ) follow, tied for the most Total Wickets (135) and an identical WpM of 6.43.
📉 The Bottom Tier: Low Wickets, Low Returns
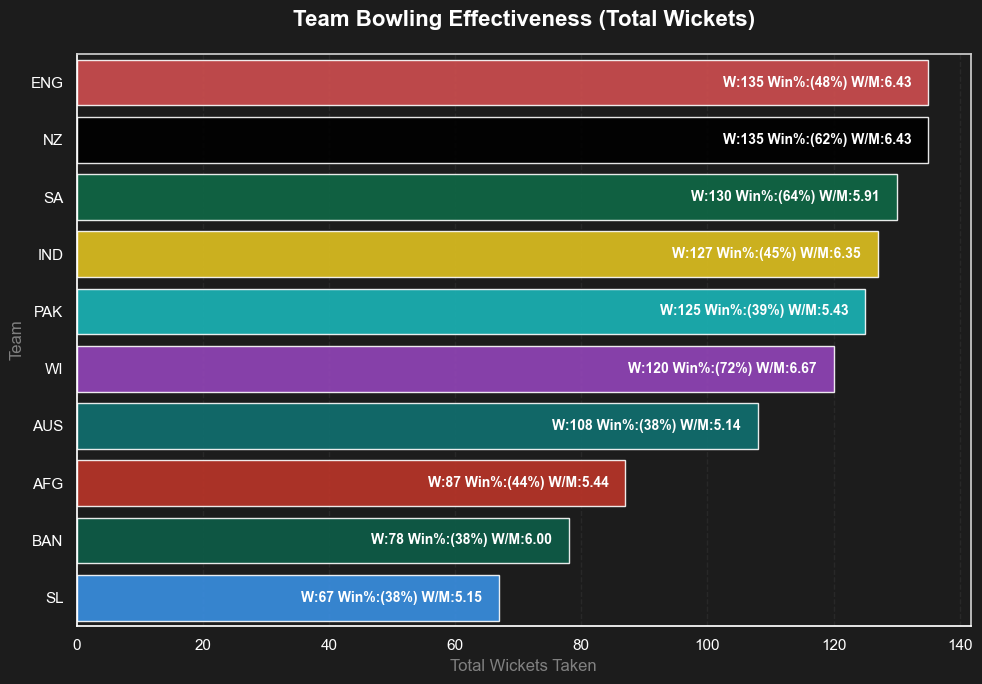
At the other end of the spectrum, Sri Lanka (SL) and Australia (AUS) demonstrate the lowest overall bowling output.
- Sri Lanka has taken the fewest Total Wickets (67) and has one of the lowest WpM ratios at 5.15.
- Australia has a marginally lower WpM of 5.14, having secured 108 Total Wickets.
- Critically, both teams are among the least successful in terms of win percentage, with SL at 38% and AUS also at 38%, underscoring the vital link between consistent wicket-taking and match success.